
Average FPS Is the Least Useful Number in Any Benchmark Chart
A practical guide to reading frame-time graphs, percentiles and latency so a benchmark chart tells you something true instead of something flattering.
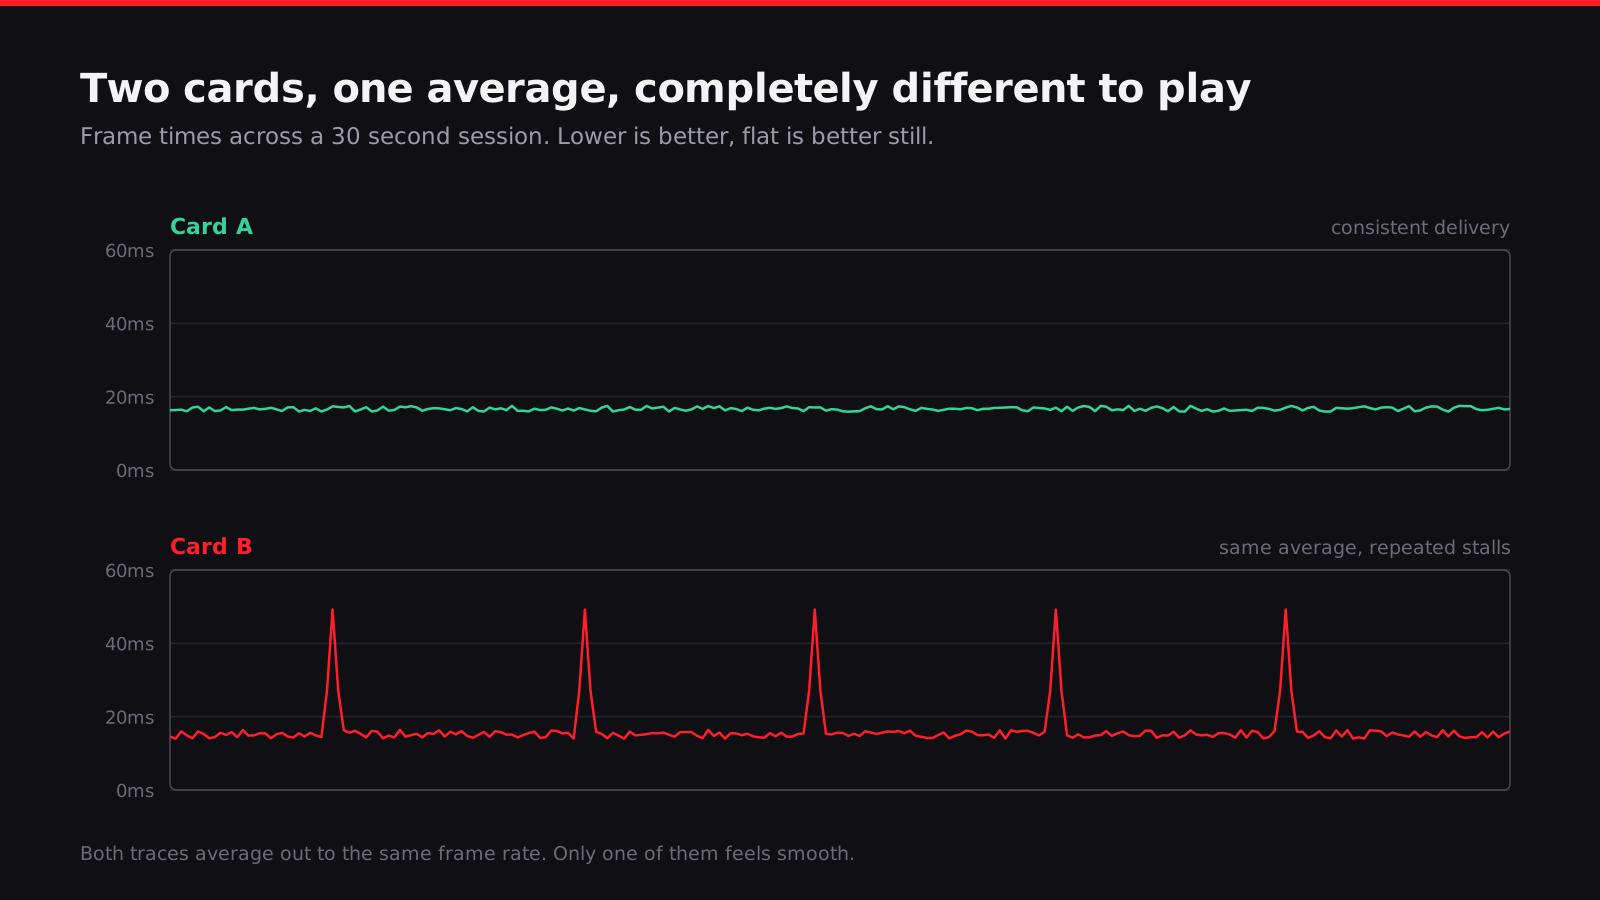
Two graphics cards can post the exact same average frame rate in the same game and feel completely different in your hands. One holds steady, the other lurches every few seconds, and the average never tells you which is which. That’s not a flaw in the testing. It’s a flaw in the number everyone agreed to lead with.
Average FPS survives because it’s easy. One number, bigger is better, done. Marketing slides love it, forum arguments run on it, and even good reviewers still put it in the headline because readers expect it there. But an average throws away exactly the information that determines how a game feels to play, which is the shape of the bad moments, not the height of the good ones.
Do the division
Start with the arithmetic, because it’s the whole argument in one line and nobody shows their work.
A frame rate is just a count of how many frames land in a second. Frame time is how long each individual frame took to render, in milliseconds. They’re the same underlying data, just inverted, and the conversion is one division: 1000 divided by the frame rate gives you milliseconds per frame.
Here’s the table. Keep it open in another tab if you want, it’s worth having on hand.
| FPS | ms per frame | ms saved vs half that rate |
|---|---|---|
| 30 | 33.3 | n/a |
| 45 | 22.2 | 11.1 |
| 60 | 16.7 | 16.7 |
| 90 | 11.1 | 5.6 |
| 120 | 8.3 | 8.3 |
| 144 | 6.9 | n/a |
| 165 | 6.1 | n/a |
| 240 | 4.2 | 4.2 |
| 360 | 2.8 | n/a |
Now look at the two comparisons the industry actually argues about. Going from 30fps to 60fps saves you 16.7 milliseconds per frame. Going from 120fps to 240fps, the exact same doubling, saves you 4.2 milliseconds. That’s a 4x difference in the actual time recovered, for the same relative jump in the FPS counter.
This is the whole trick of the FPS number and I don’t think most players have ever had it pointed out explicitly. Frame rate is not a linear scale of how good things feel. It’s the reciprocal of one, and reciprocals compress at the top end. The jump from 30 to 60 is the difference between a game feeling laggy and feeling fine. The jump from 120 to 240 is real, I’m not saying it’s nothing, but it’s a much smaller slice of actual time, and past a certain point your display, your eyes and your input chain start mattering more than the extra frames do.
This is also why “just look at the FPS number going up” breaks down as a shopping heuristic once you’re above 100fps or so. A card that goes from 130fps to 160fps improved by 23% on the chart. In milliseconds that’s 7.7ms down to 6.25ms, a save of 1.4 milliseconds. You will struggle to feel that in most games. A card that goes from 45fps to 55fps improved by “only” 22% on the chart, nearly identical percentage, but that’s 22.2ms down to 18.2ms, a 4ms save in a range where every millisecond is doing real work on how responsive the game feels. Same percentage gain, wildly different value, and the FPS chart alone can’t tell you which situation you’re in. You have to do the division yourself.
Percentiles, and the trap hiding inside them
Once you accept that averages hide bad frames, the next question is how you measure the bad frames without just eyeballing a graph. This is where “1% low” and “0.1% low” come from, and it’s also where two respected outlets can report numbers for the same run that don’t actually mean the same thing.
There are two genuinely different calculations that both get called a percentile low, and the difference matters more than people admit.
The first is a true percentile of the frame time distribution. You take every frame time recorded during the run, sort them, and find the value at the 99th percentile, meaning 99% of frames were faster than this and 1% were slower. That single frame time is your “1% low,” expressed by convention as an FPS-equivalent number for readability.
The second is an average of the slowest frames. You take the worst 1% of frames by count, and instead of picking the boundary value, you average all of them together. If your test run captured 6,000 frames, that’s the average of the worst 60.
These sound like the same thing. They are not. The percentile method reports a single boundary point, essentially “how bad does it get right at the 99th percentile line.” The averaging method smooths across the whole worst slice, which means one catastrophic hitch, a single frame that took 200 milliseconds because of a shader compile stall, gets diluted by the 59 other frames it’s averaged with. A tool using the percentile method would catch that stall much more visibly if it happened to land near the boundary, and could actually understate it if the stall was rare enough to sit deeper than the 1% cutoff. A tool using the averaging method smooths single outliers into invisibility but is more stable run to run and less prone to being skewed by one freak event.
Neither approach is wrong. They’re answering slightly different questions, and both are useful. The problem is that outlets don’t always say clearly which one they ran, and readers compare a “1% low” from one site against a “1% low” from another as if the label guarantees the method. It doesn’t. If you’re comparing numbers across two different testing tools or two different outlets, check whether they document their percentile methodology before you treat the numbers as apples to apples. Most don’t say, honestly, which is its own small scandal nobody talks about.
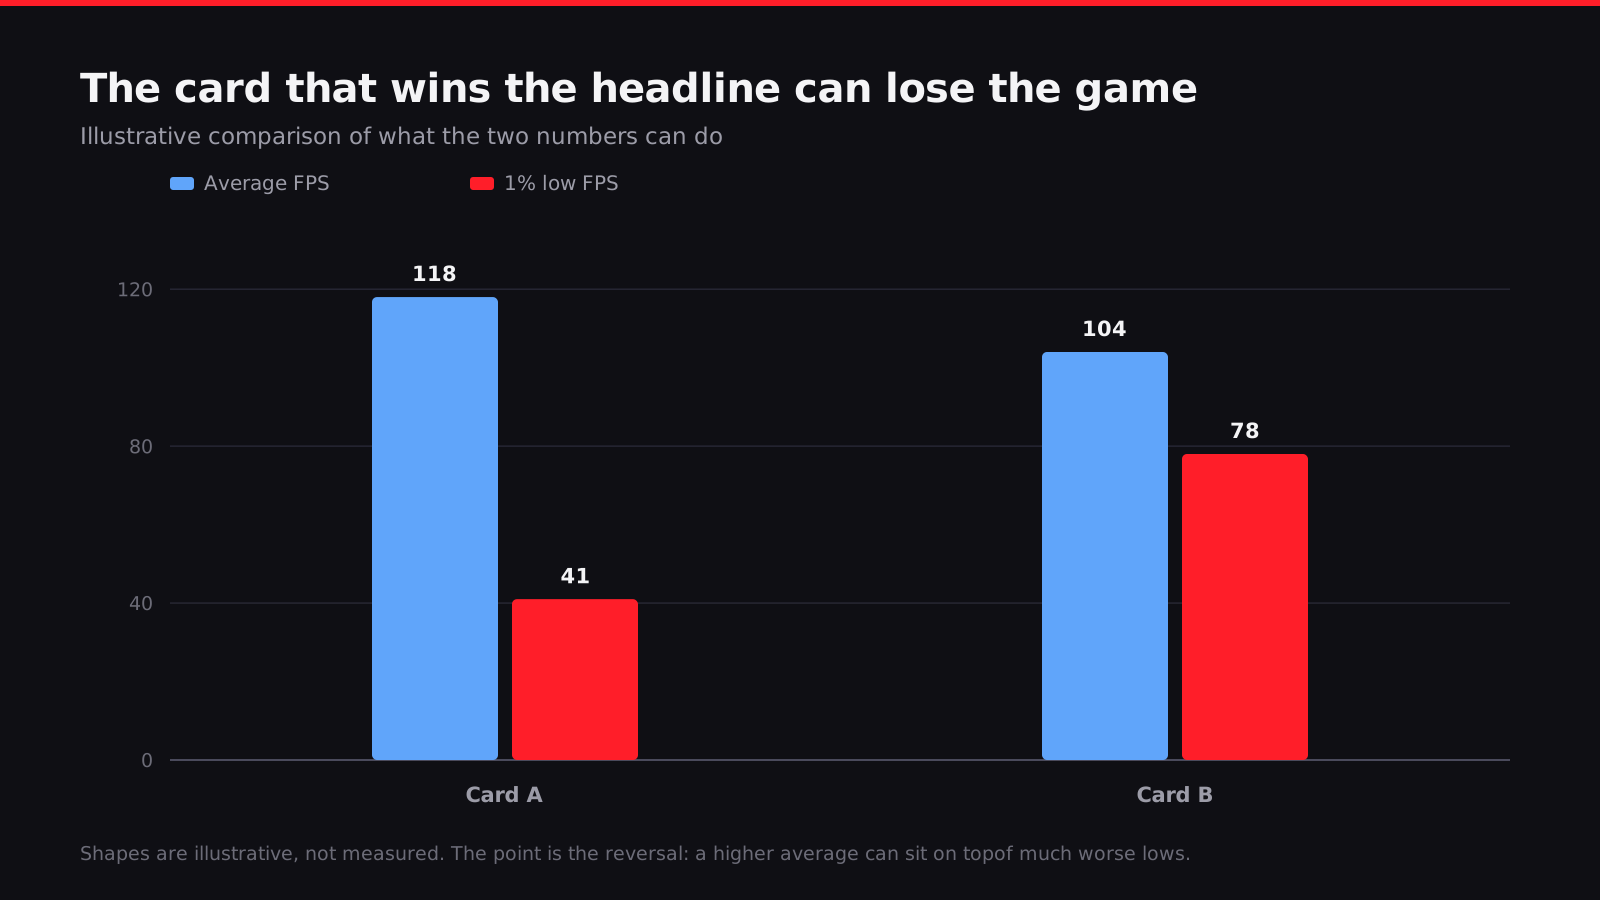
Why does any of this beat the average? Because the average is dominated by the easy parts of a run. Open a menu, stand in an empty corridor, look at a sky box, and you’ll rack up frames well above whatever the game needs during a firefight or a crowded market street. Those easy frames pull the average up and bury the hard ones. The 1% low and 0.1% low exist specifically to surface what happens during the worst 1% or 0.1% of frames, which correlates far better with the moments you’d actually describe as “it chugged there” after a session.
A card with a lower average and dramatically better lows is, in my opinion, very often the correct choice over a card with a flashier average and a nastier tail. Averages sell hardware. Lows tell you how it will feel three hours into a raid boss with forty particle effects on screen. Reviewers who lead with the average and bury the lows in a footnote are, whether they mean to or not, optimizing their headline for the number that’s easiest to win rather than the number that’s most honest.
Stutter is not the same problem as low frame rate
Here’s a distinction that gets flattened constantly, and it’s probably the single most under-explained idea in consumer hardware coverage. A low frame rate and a stuttery frame rate are different failures with different causes, and fixing one does nothing for the other.
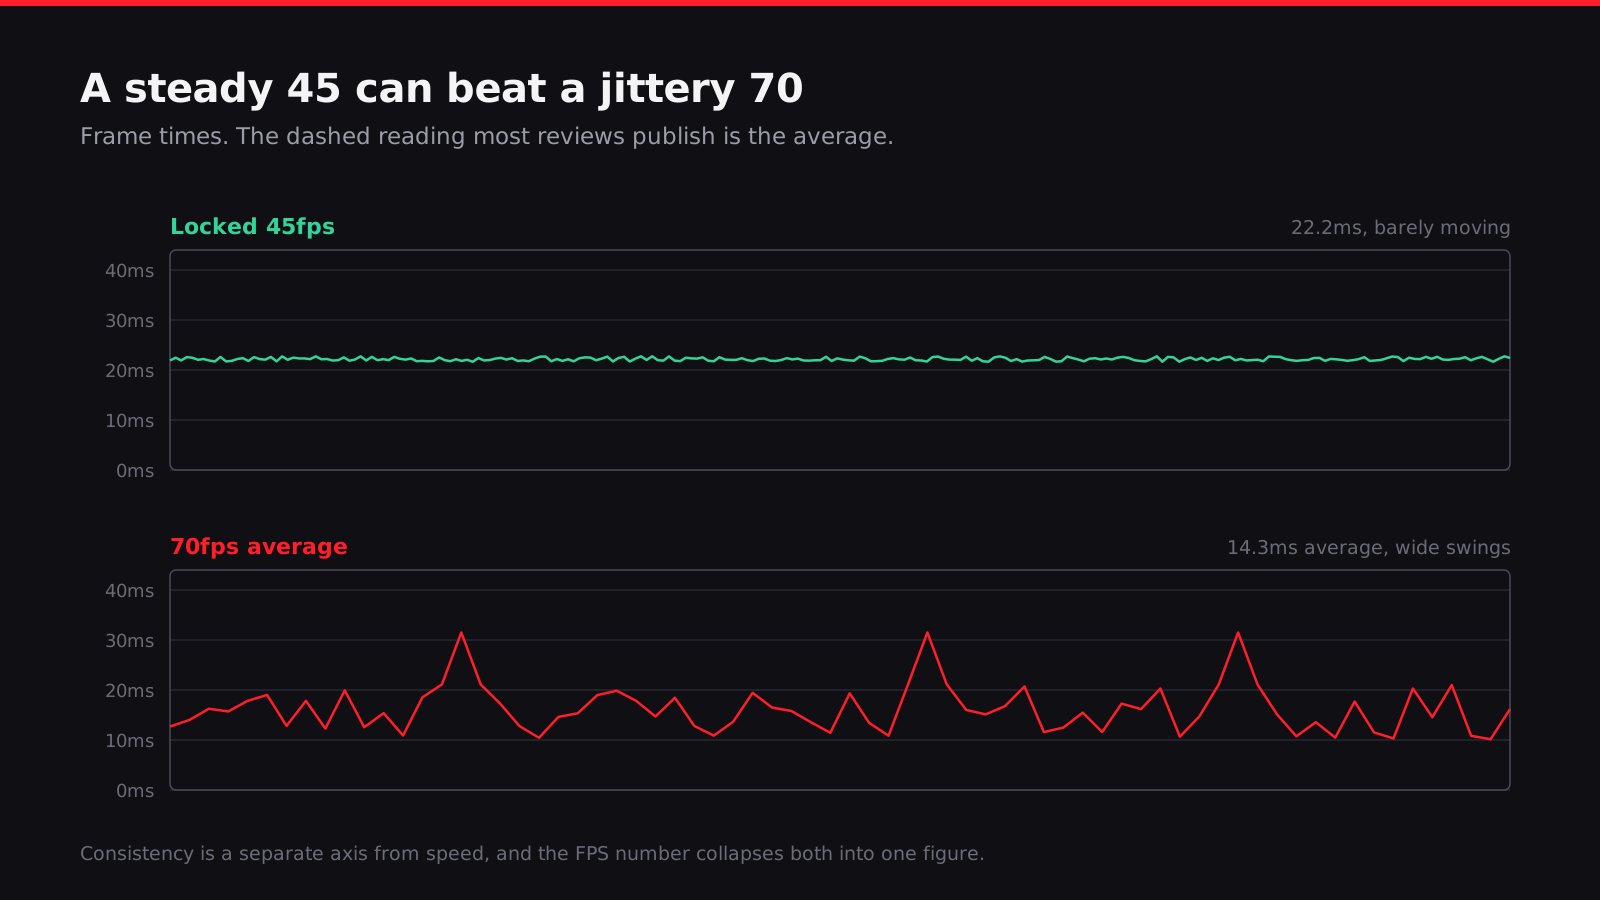
A perfectly steady 45fps means every frame arrives roughly 22 milliseconds apart, consistently, forever. Your brain and your input timing adapt to that rhythm fast. It’s not fluid in the way 120fps is fluid, but it’s predictable, and predictable is something the human visual system handles surprisingly well.
A jittery 70fps average might be swinging between 40ms gaps and 8ms gaps from one frame to the next. The average of those numbers looks great on a chart. The actual experience is a stream of frames arriving at irregular intervals, which reads to your eyes as juddering even though the frame rate counter is nominally higher than the steady 45. I’d take the steady 45 over the jittery 70 in almost every case, and I think most people who’ve actually played both back to back would agree with me.
This is frame pacing, and it’s a genuinely separate axis from raw throughput. A GPU can be fast enough to render 70 frames in a second and still deliver them unevenly, because the variance comes from somewhere upstream of raw rendering horsepower.
Where does that variance actually come from? A few recurring sources:
- CPU frame assembly stalls. If the CPU can’t hand off draw calls to the GPU at a steady cadence, because of a physics tick, an AI pathing update, or a garbage collection pause in the engine, the GPU sits idle waiting and then has to catch up, producing an uneven output stream even though it’s plenty fast.
- Asset streaming. Open-world games load textures and geometry as you move. Cross a trigger volume and the engine may need to pull in new assets right now, which competes for the same memory bandwidth and storage I/O the frame needs, and you get a hitch exactly when the camera pans toward something new.
- Shader compilation. The first time a new visual effect, material or particle system appears, some engines compile the shader for it on the spot rather than ahead of time. That’s a multi-frame stall, sometimes very large, that only happens once per shader per session.
- Driver-level frame queuing. How many frames the GPU driver is allowed to queue ahead of the display changes how much the system can absorb a momentary slowdown versus passing it straight through to what you see.
VRR, whether it’s called G-Sync, FreeSync or just adaptive sync in the OS settings, solves a specific and narrower problem than people give it credit for. Without VRR, your display refreshes at a fixed interval regardless of when the GPU actually finishes a frame, which produces tearing if a new frame isn’t ready in time, or forces the GPU to wait if it finishes early. VRR lets the display’s refresh match the GPU’s actual frame delivery, frame by frame, which removes tearing and removes the artificial wait.
What VRR does not do is make an inconsistent GPU output stream feel consistent. If the underlying frame times are jumping between 8ms and 40ms, VRR will faithfully display that variance without tearing, but the variance is still there and you’ll still feel it as judder or a sense of the game “catching.” VRR smooths the symptom of mismatched refresh timing. It does not smooth the underlying cause of an uneven pipeline. People buy a VRR monitor expecting it to fix stutter wholesale, and it fixes a real problem, just not that one.
Latency lives on its own axis entirely
Everything above is about frame delivery. None of it is about how the game responds to your input, and that’s a genuinely separate measurement that an FPS chart cannot show you at all.
The relevant number here is click-to-photon latency, the total time from the moment you physically move the mouse or press the button to the moment the corresponding change actually appears lit up on the screen. That total includes input polling, engine processing, render time, the queue between GPU and display, and the display’s own response time. Frame time, the thing your FPS number is built from, is only one link in that chain.
This is why frame generation is worth being skeptical of as a headline number. Frame generation technology, however a given vendor implements it, creates additional frames by interpolating between two frames the game actually rendered, then displays them in between. Your FPS counter, which just counts frames shown per second, goes up, sometimes dramatically. But the interpolated frames aren’t responding to new input. They’re a visual smoothing pass sitting between two frames that were responding to input, and the engine typically has to hold the most recent real frame slightly longer to have both endpoints ready for the interpolation. That’s added latency, not removed latency, layered under a bigger FPS number.
So you can end up with a genuinely uncomfortable outcome: the FPS chart says 120, the game shows more frames per second than it used to, and the actual responsiveness to your input, the click-to-photon number, is slightly worse than it was running native at a lower displayed frame rate. That’s not a defect in frame generation as a smoothness technology, it does what it says, motion looks smoother on screen. It’s a mismatch between what the FPS counter is measuring and what “feels responsive” actually depends on. A chart built purely from displayed frame rate cannot tell those two things apart, because it was never measuring the input chain in the first place.
If you only look at one number when deciding whether frame generation is worth turning on for a competitive game, make it latency, not the FPS counter. The counter will lie to you cheerfully and the latency number won’t.
This matters most in genres where reaction time is the whole game. In a slow single-player story game, a bit of extra latency alongside smoother-looking motion is a completely reasonable trade and plenty of players will correctly prefer it. In a fast shooter, that same trade can cost you the duel, and the FPS chart handed to you at launch will show a bigger number the whole time it’s costing you.
Where the real lies live: methodology
This is the section that determines everything else, because a badly designed test produces a technically accurate number that still tells you nothing useful. Most benchmark disagreements you see argued about online aren’t actually disagreements about hardware. They’re disagreements about method that nobody stated out loud.
Built-in benchmark tools versus real gameplay. A lot of games ship an internal benchmark mode that runs a scripted camera path through a curated scene. These are convenient, repeatable, and often not representative of the parts of the game that actually stress hardware the hardest, because developers have an incentive to make their built-in benchmark run smoothly. A dense firefight with forty NPCs and particle effects everywhere will usually punish a system far harder than a benchmark fly-through ever will, and that difference doesn’t show up unless someone actually plays the game and logs it.
Run-to-run variance. A single benchmark pass, of anything, on any system, is close to meaningless on its own. Background processes, thermal state at the start of the run, storage cache state, even which core the OS scheduler happens to park a thread on, all of it shifts results by a few percent run to run. A reviewer who publishes one number per configuration is either extremely confident their pipeline has zero variance, which is unlikely, or didn’t check. The honest version of a benchmark result is a range across several runs, or at minimum a note that multiple runs were averaged and how much they varied.
Warm versus cold shader caches. The first time a game compiles shaders for a given GPU and driver combination, whether that happens at install, at first launch, or on the fly during play, that run will show worse frame time consistency than every run after it. Testing cold, straight after install, versus testing warm, after the cache is built, can produce materially different stutter profiles for the exact same hardware. If a review doesn’t say which state it tested in, assume you don’t actually know.
CPU-bound versus GPU-bound scenes. At a low resolution or with a fast enough GPU, the CPU becomes the bottleneck, and no amount of GPU upgrade will move the number, because the GPU is sitting there waiting for instructions. At a high resolution with a demanding GPU, the CPU has spare capacity and the GPU is now the limiting factor. A reviewer’s choice of test scene, and the resolution and settings paired with it, quietly decides in advance whether the test is measuring the CPU or the GPU, and two perfectly honest reviewers testing the identical part in the identical game can reach opposite conclusions about which component matters more, purely because they picked different scenes or resolutions to test at.
Resolution scaling. Performance does not scale linearly with resolution, and the gap between two GPUs often changes shape entirely between 1080p, 1440p and 4K, sometimes narrowing, sometimes widening, depending on which one runs out of bandwidth or compute first. A comparison run only at one resolution is telling you about that resolution and nothing else.
Driver versions. Both AMD and Nvidia ship driver updates regularly, and per-game optimization work is a real and ongoing thing, not a one-time launch event. A benchmark run on a driver from three months ago is testing a GPU that, in some specific games, may no longer exist in that exact form. Reputable reviews list the driver version tested. If an article doesn’t, that’s a small red flag, not a fatal one, but worth noticing.
Was upscaling on. DLSS, FSR and similar technologies render at a lower internal resolution and reconstruct up to the display’s native resolution, trading some image fidelity for frame rate. Whether upscaling was enabled, and which quality preset, is not a footnote, it’s close to the entire result. Comparing two systems where one had upscaling on and the other didn’t isn’t a GPU comparison anymore. It’s a comparison of two entirely different render pipelines that happen to end up on the same size of screen.
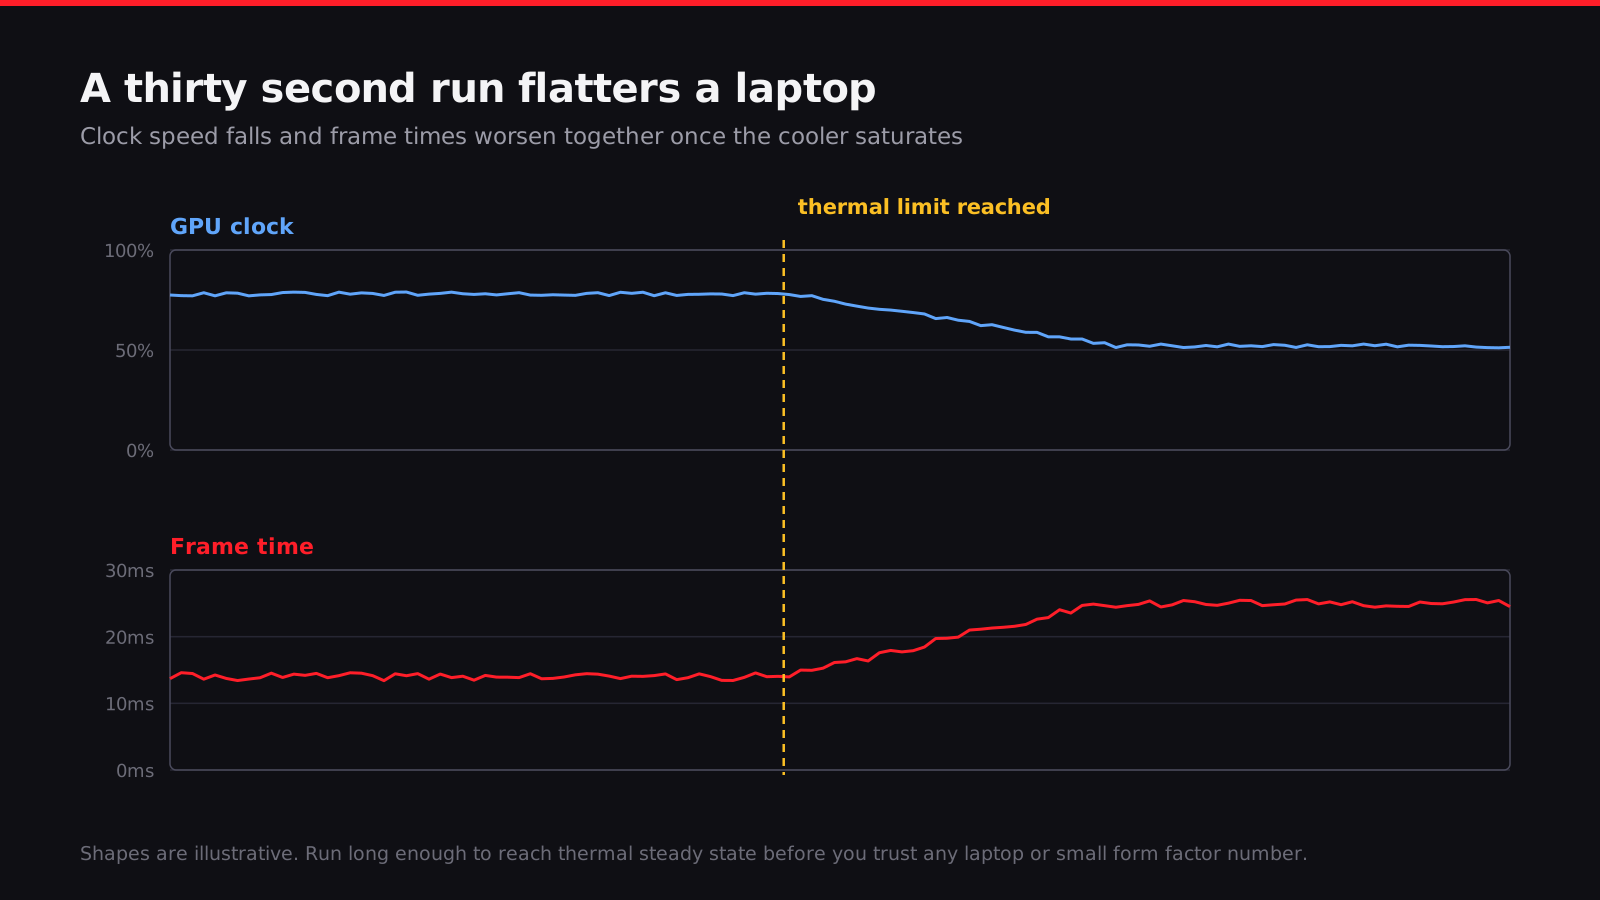
Thermal soak. A laptop or a small-form-factor desktop can sustain its rated clock speeds for the first thirty seconds to a minute of a demanding load and then throttle down hard once the chassis actually heats through. A short benchmark run flatters exactly the systems with the least cooling headroom, because it never runs long enough to hit the throttle point. Anyone testing a laptop who runs a 30-second loop and calls it done is, whether they intend to or not, reporting the best-case number rather than the number you’ll actually get twenty minutes into a game.
VRAM limits that only show up minutes in. Some stutter and frame time degradation only appears once VRAM usage climbs past a card’s available memory, which can take several minutes of continuous play in an open world before textures and asset streaming pressure build up enough to trigger it. A short test window will miss this completely and report a card as fine when it actually starts struggling in exactly the kind of long session most people actually play.
Reading a chart built to sell you something
None of the above is exotic. Reviewers who care about methodology already account for most of it. Marketing decks are a different animal entirely, because the goal of a marketing chart isn’t to inform you, it’s to close a sale, and every visual choice on the slide is downstream of that goal.
A few patterns worth training your eye to catch:
The truncated Y axis. A bar chart that starts at 40 instead of 0 turns a modest 10% improvement into a bar that looks twice as tall. This is the oldest trick in chart design and it still works on smart people constantly, because nobody stops to check where the axis actually starts.
The missing baseline. “Up to 2x faster” tells you nothing without knowing 2x faster than what, in which game, at which settings, on which previous generation part. The comparison point is often the weakest configuration that makes the new product look best, not the configuration you’d actually be upgrading from.
“Up to.” Any claim with “up to” in front of it is reporting the single best result the marketing team could find across every test they ran, not a typical result. It’s not dishonest exactly, the number did happen somewhere, in something. It’s selective in a way that a chart’s clean typography works hard to make you forget.
Cherry-picked scenes. If a company is showing you benchmark results for exactly the three games where its new part does best, and none of the twenty other games it also tested, that’s not lying, it’s marketing doing what marketing does. But it does mean the chart tells you about those three games specifically and nothing about how the part performs broadly.
Mismatched settings across the comparison. This one’s the sneakiest and I think the most common. A company demos a new card running a game with upscaling and frame generation both enabled, next to last generation’s card running the same game with both turned off, and presents the resulting gap as if it’s purely generational hardware improvement. Some of that gap is real silicon progress. Some of it is comparing two entirely different rendering pipelines and calling it one number. Unless a slide explicitly states both configurations used identical settings, assume they didn’t, because if they had, that fact would be the easiest possible thing to put on the slide and companies love putting easy flattering facts on slides.
The composite “average across our test suite.” A number built by averaging results across fifteen or twenty games is real data, and it’s not fake. But it also actively hides the one game you personally play, which might sit well above or well below that average depending on how well it happens to be optimized for the hardware in question. A suite average is a description of a generic library, and you don’t own a generic library.
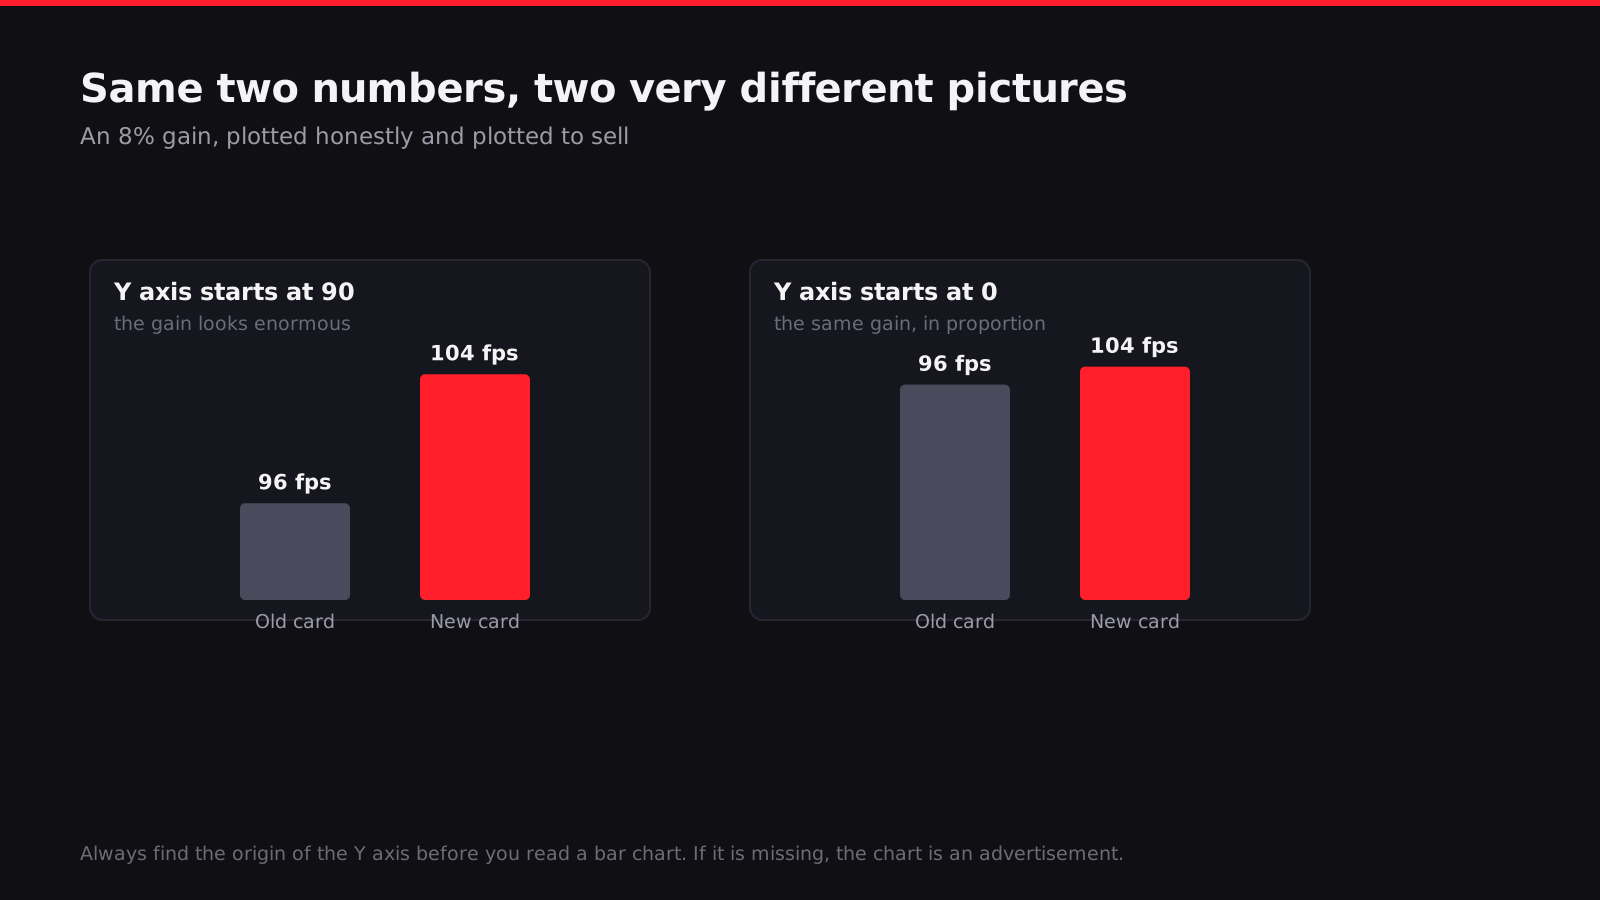
My honest opinion, and I think it’s a defensible one even if it annoys people who write these charts for a living: the industry settled on average FPS as the standard headline metric specifically because it’s the easiest number to make look good, not because it’s the number that best predicts how a game will feel in your hands. That’s not a coincidence and I don’t think it’s an accident either. It’s the metric that survives contact with a marketing department the best, and reviewers who still lead their headline number with a bare average, even when their underlying data and methodology are completely honest, are doing their readers a real disservice by training everyone to keep looking at the wrong line on the chart.
How to actually run a benchmark you can trust
If you want numbers you can rely on, whether you’re deciding between two GPUs or just checking whether a driver update helped, here’s what I’d actually do.
Log frame times, not just frame rate, if your tool supports it. CapFrameX, PresentMon, RivaTuner Statistics Server and similar tools can all capture per-frame timing data, and most in-game overlays worth using will show you a 1% low or 0.1% low alongside the average, not just the average alone.
Run the same scene at least three times, ideally more. Throw out an obvious outlier only if you can explain why it happened, a background update kicking off, say, and never throw one out just because it made your preferred hardware look worse.
Let the system reach thermal steady state before you trust the numbers. That means running for several minutes before you start logging, not several seconds. On a laptop especially, the first minute of any demanding test is close to useless as a predictor of what you’ll actually experience.
Test in the part of the game that’s actually hard on the hardware, not the easiest corridor you can find. If you play open-world games, test in a busy town, not an empty field. If you play shooters, test during a real firefight with effects going off, not while staring at a wall in spawn.
Match settings deliberately and note them down. Resolution, upscaling mode and quality level, frame generation on or off, ray tracing on or off, driver version. If you change one thing between two runs, change only that one thing, and write down what changed so you actually know what you’re comparing.
And look at the graph, not just the summary numbers underneath it. A frame time trace will show you a shape. A single number can’t. If you see a flat consistent line, that’s a system behaving well regardless of what the raw average happens to say. If you see spikes, even occasional ones, you now know something no average could have told you, which is where and roughly how often things go wrong.
I keep coming back to the same thought whenever I read a new benchmark chart, whether it’s from a reviewer I trust or a company trying to sell me something. The average is the number that took the least effort to produce and the least effort to understand, and that’s exactly why it became the standard. Everything genuinely interesting about how a game feels, the stutter, the tail, the input lag hiding under a bigger frame counter, lives in the parts of the data an average was specifically invented to throw away. Next time a chart hands you one clean number and asks you to trust it, ask what got averaged out to make it that clean.
Read next
Unreal Engine 5 Stutter Isn't One Problem, It's At Least Three
Shader compilation, traversal streaming and expensive rendering features all cause stutter in Unreal Engine 5 games, but they have different causes, fixes and levels of developer blame.

The Steam Machine is the most principled console you probably shouldn't buy
Valve's six-inch cube costs $1,049 because Valve refuses to sell hardware below cost. Here is whether that principle, and the engineering behind it, justifies the money.
The bugs don't sink a broken launch. The apology does.
S.T.A.L.K.E.R. 2 shipped broken and became Game of the Year. Borderlands 4 shipped broken and lost its opening week. The difference was never the bug list.